My Projects
Analytics projects built from real data in SQL, Tableau and Excel, plus Ascend RPG, a fitness app I designed, built and launched on Google Play and the App Store.

Ascend RPG
Featured project · Live on Google Play and the App Store
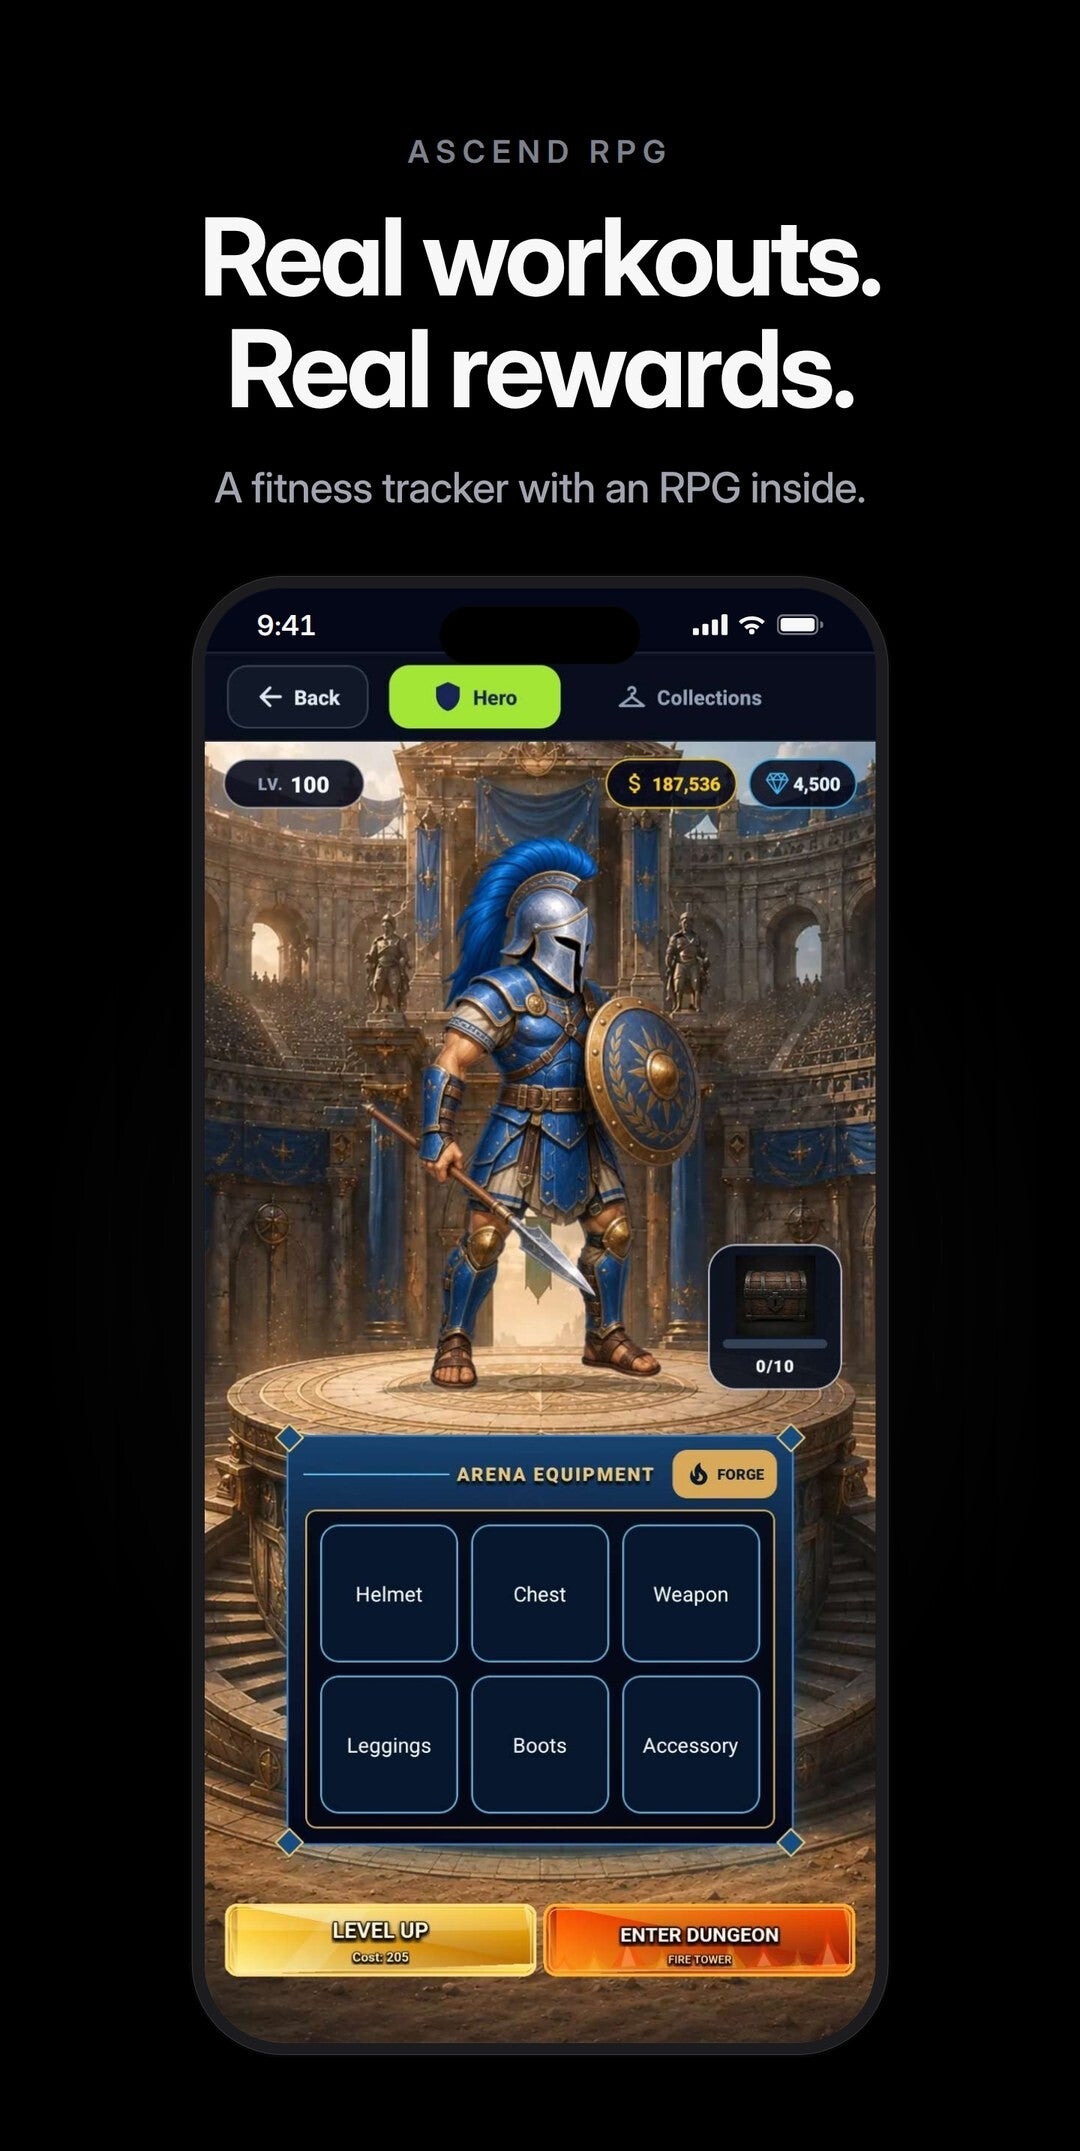
A fitness tracker with an RPG inside.
Designer & developer · Published by Dual Force Digital LLC · Launched 2026
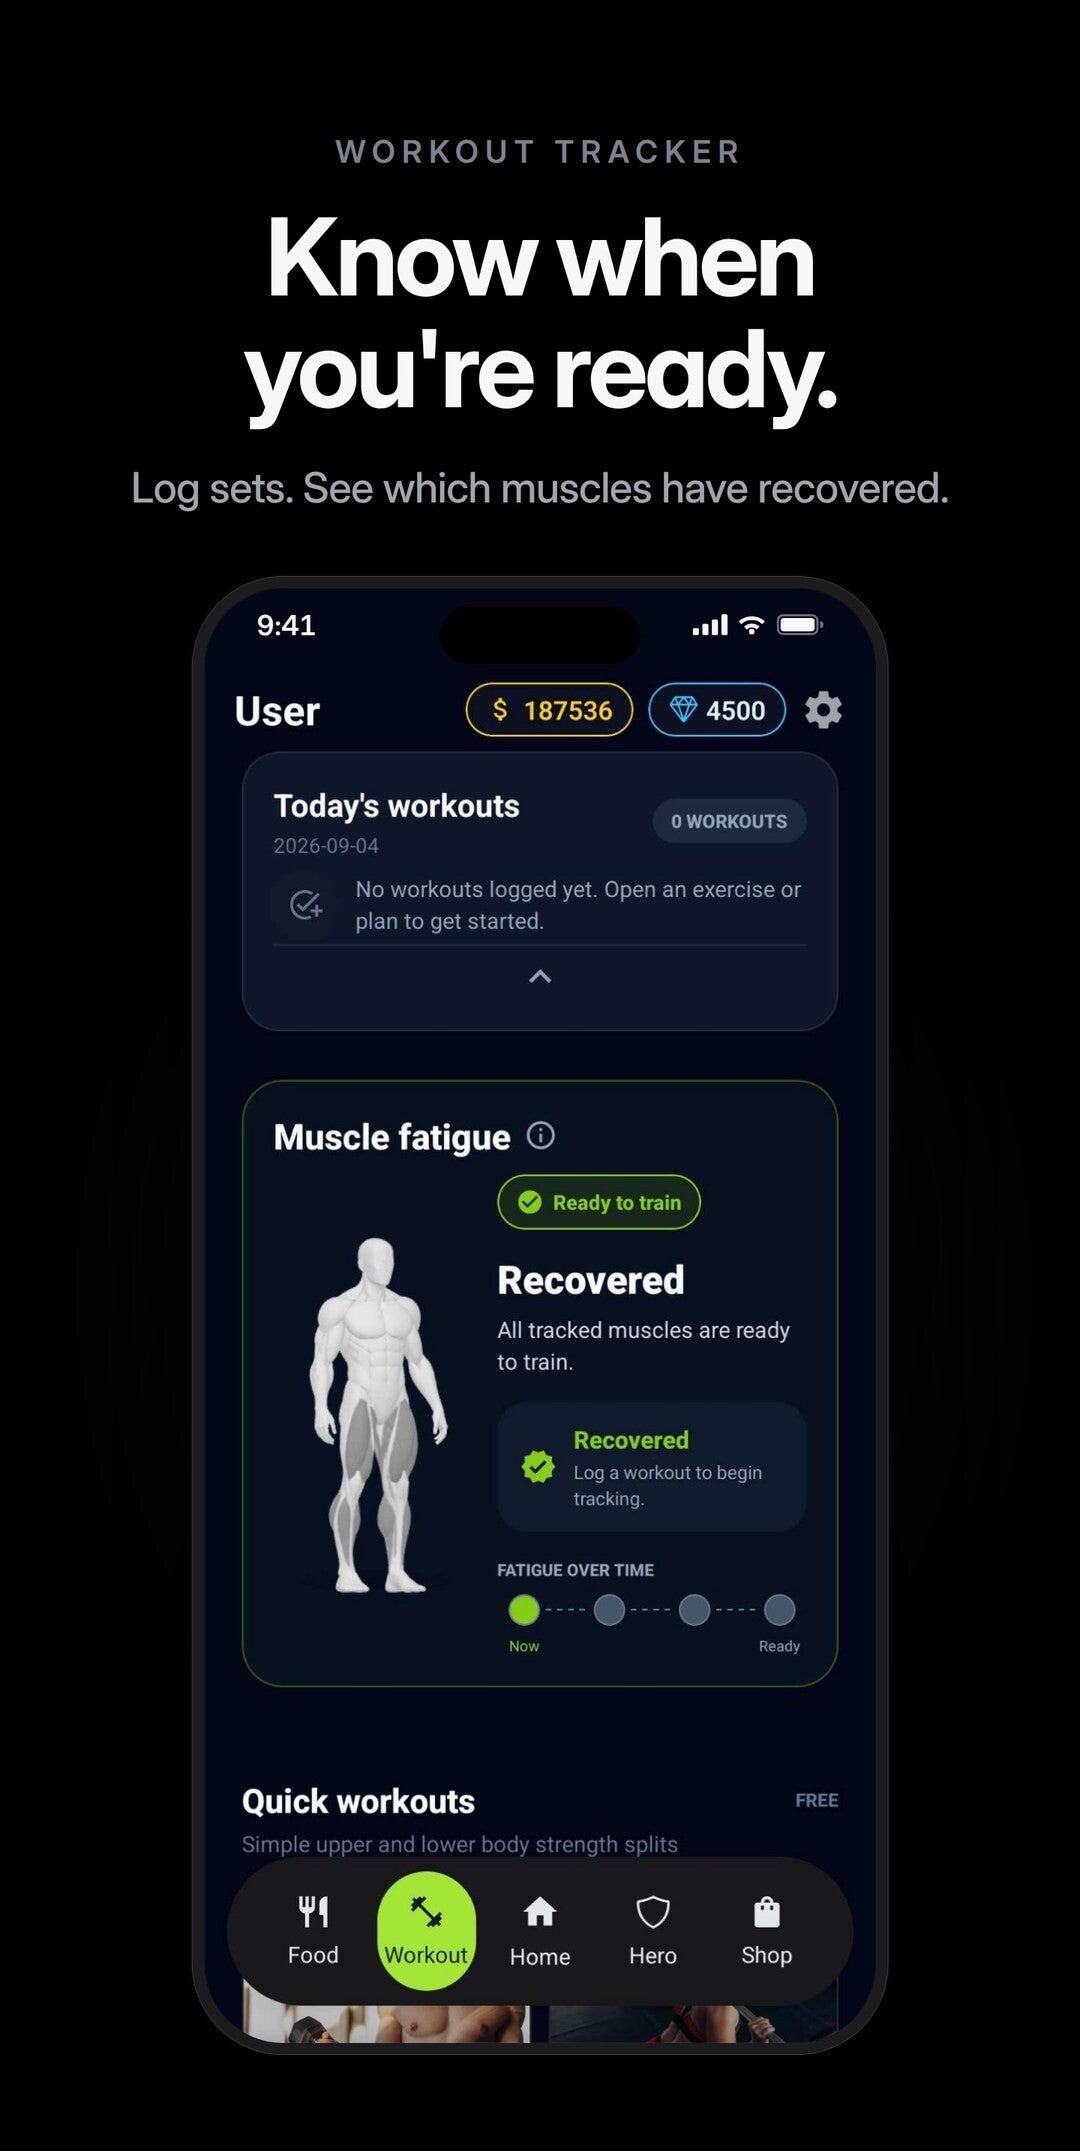
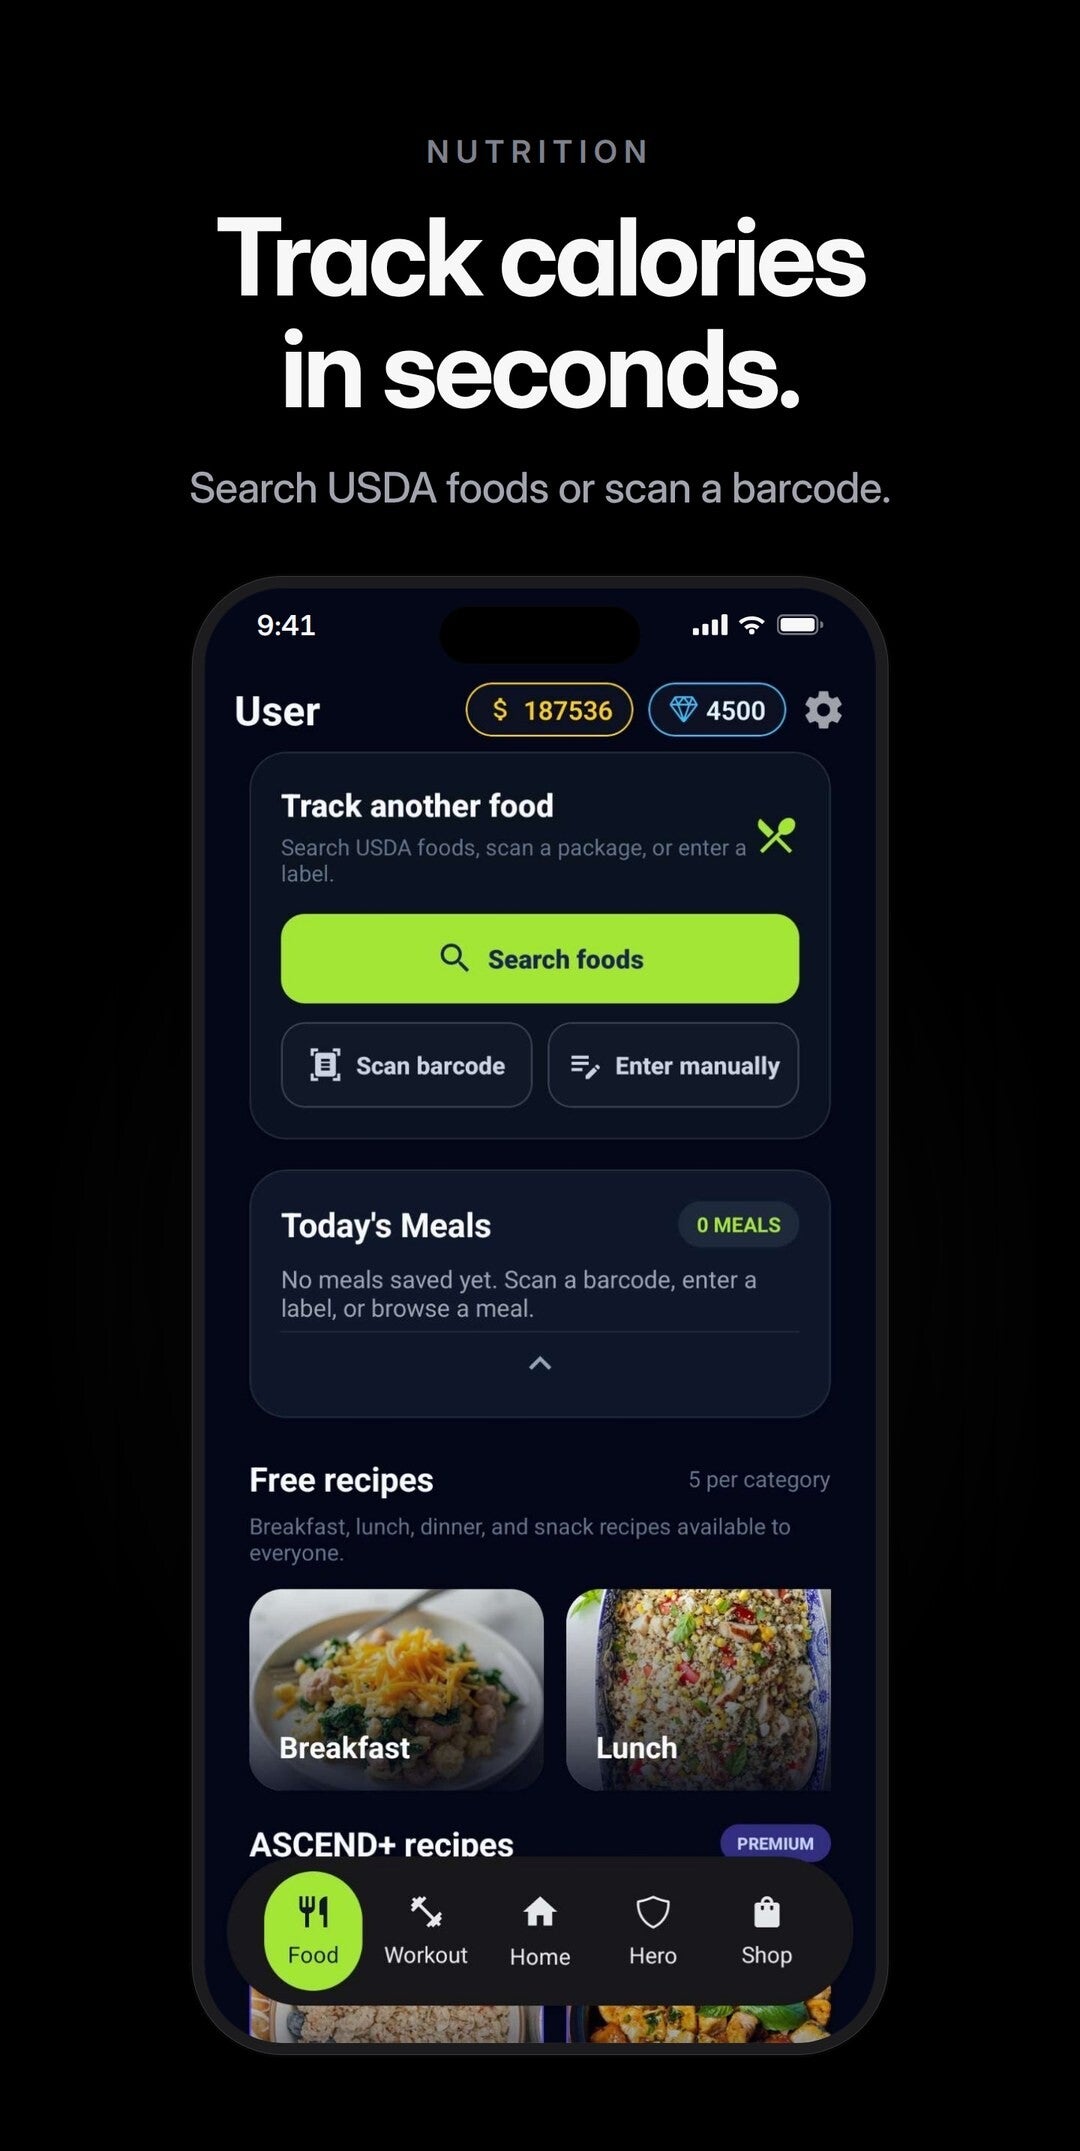
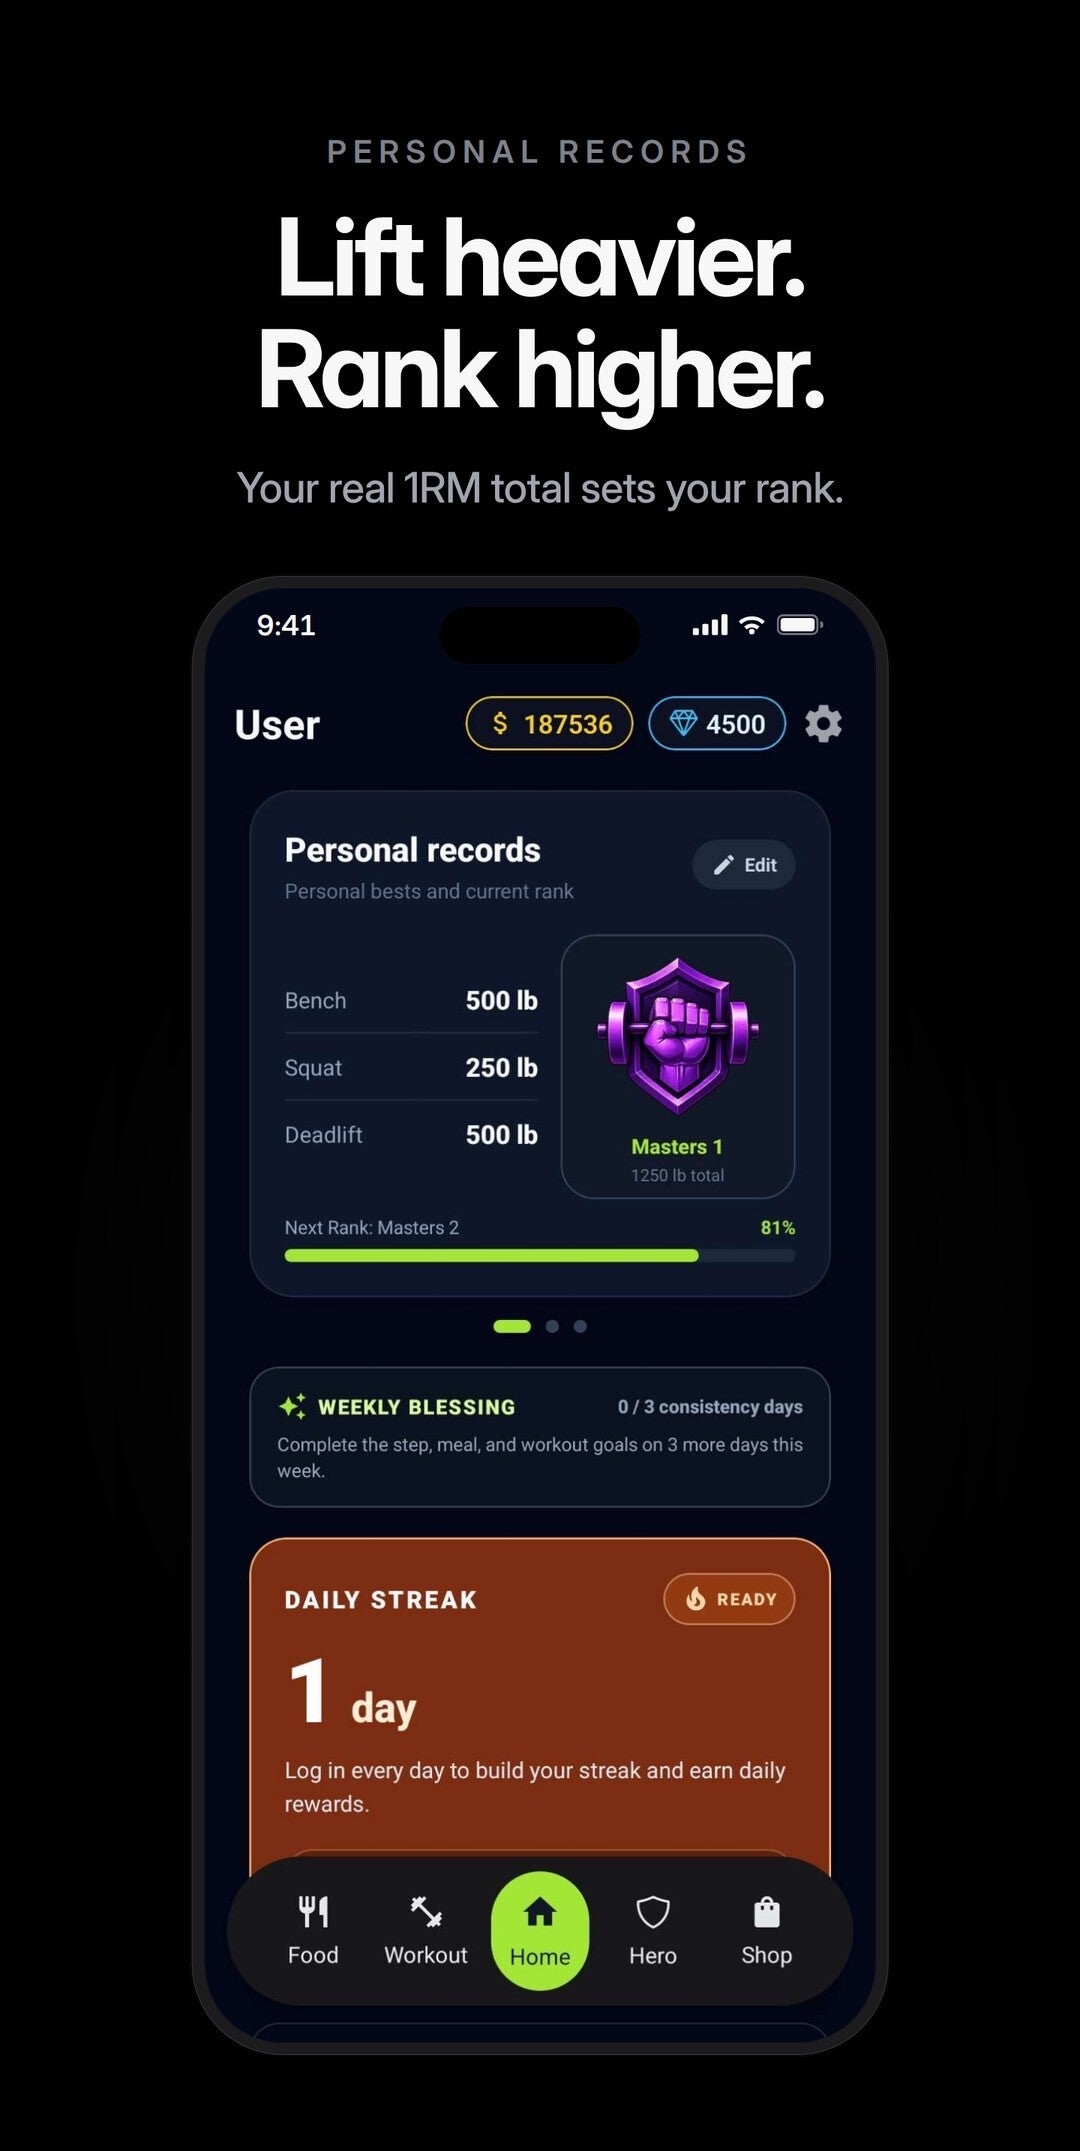
Ascend is a fitness app first. It tracks workouts and muscle recovery, logs calories with USDA food search and barcode scanning, counts steps, and includes 200+ recipes. The RPG layer turns that activity into progress: workouts, meals and steps earn XP, coins and gear for your hero, and your real one-rep-max total sets your rank.
I designed and built the whole product: the React Native (Expo) app, a Phaser game embedded inside it, a Supabase backend for accounts and progress, and the in-game economy. It’s free to play with no pay-to-win. Ascend Pro adds cosmetics and content, never power.
Tools: React Native (Expo) · JavaScript · Supabase (PostgreSQL) · Phaser · UI/UX design · Google Play & App Store release
San Antonio Crime Intelligence Dashboard
SQL · SQLite · Tableau
I cleaned and transformed 49,999 public-safety records with SQL and SQLite, standardizing dates and adding year, month and day-of-week fields. The Tableau dashboard analyzes 31 crime types across 65 ZIP codes, with geographic hotspots, monthly trends and service-area comparisons.
Interactive filters let you explore crime by time, location and offense type.
Tools: Tableau Desktop · SQL · SQLite · interactive filters and charts

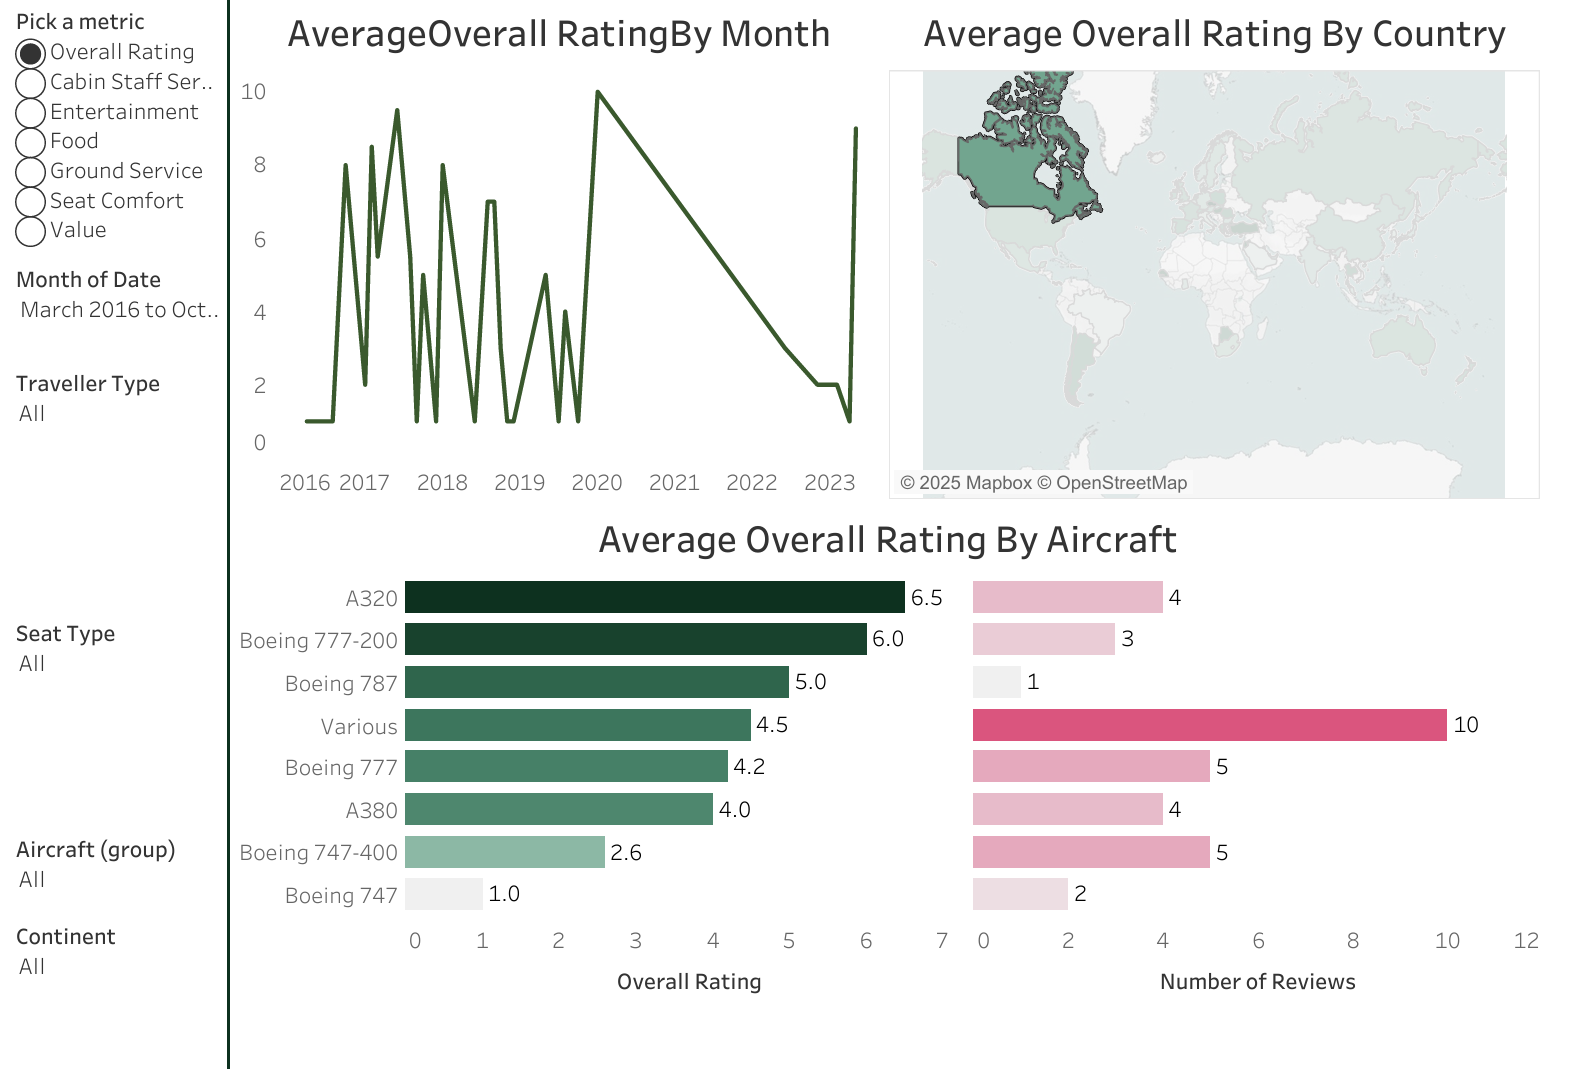
British Airways Customer Review Analysis
Tableau
An interactive Tableau dashboard of British Airways customer reviews, broken down by aircraft type, service category (cabin staff, entertainment, food and beverage, ground service, seat comfort), geography and time.
I compared customer-experience KPIs to find which aircraft and services pull ratings down, and where ratings differ by region.
Tools: Tableau Desktop · dashboard design · KPI analysis · interactive filters

Coffee Sales Dashboard in Excel
Excel · PivotTables
I cleaned and organized raw coffee-shop transactions in Excel, then used pivot tables and charts to show revenue trends, top-selling coffee types, peak sales periods, and sales by country and customer.
The dashboard turns transaction data into answers a shop owner can act on.
Tools: Microsoft Excel · pivot tables · data cleaning · charts